
There Is No Best Trap — But There Are Better Ones
Trap 1 gets talked about the most. Trap 6 at Harlow gets results. The question of whether one starting trap has a systematic advantage over the others is one of the most debated topics in UK greyhound betting, and the answer is both simpler and more nuanced than most punters expect. There is no universally best trap. Across the full sample of thousands of races run at GBGB-licensed tracks, the winning percentages for each trap are close enough to random that no single position dominates. But zoom into individual tracks and specific conditions, and the picture changes. Some traps at some venues produce winning percentages that are genuinely exploitable.
The reason for this is geometry. Every greyhound track has a unique layout — different circumferences, different cambers on the bends, different distances from the traps to the first turn. These physical characteristics create small but persistent advantages for certain starting positions. At a track where the run from the traps to the first bend is short, inside traps have less distance to cover and a better angle into the turn. At a track with a long run-in to the first bend, that advantage is diluted because all six dogs have time to find their position before the track curves.
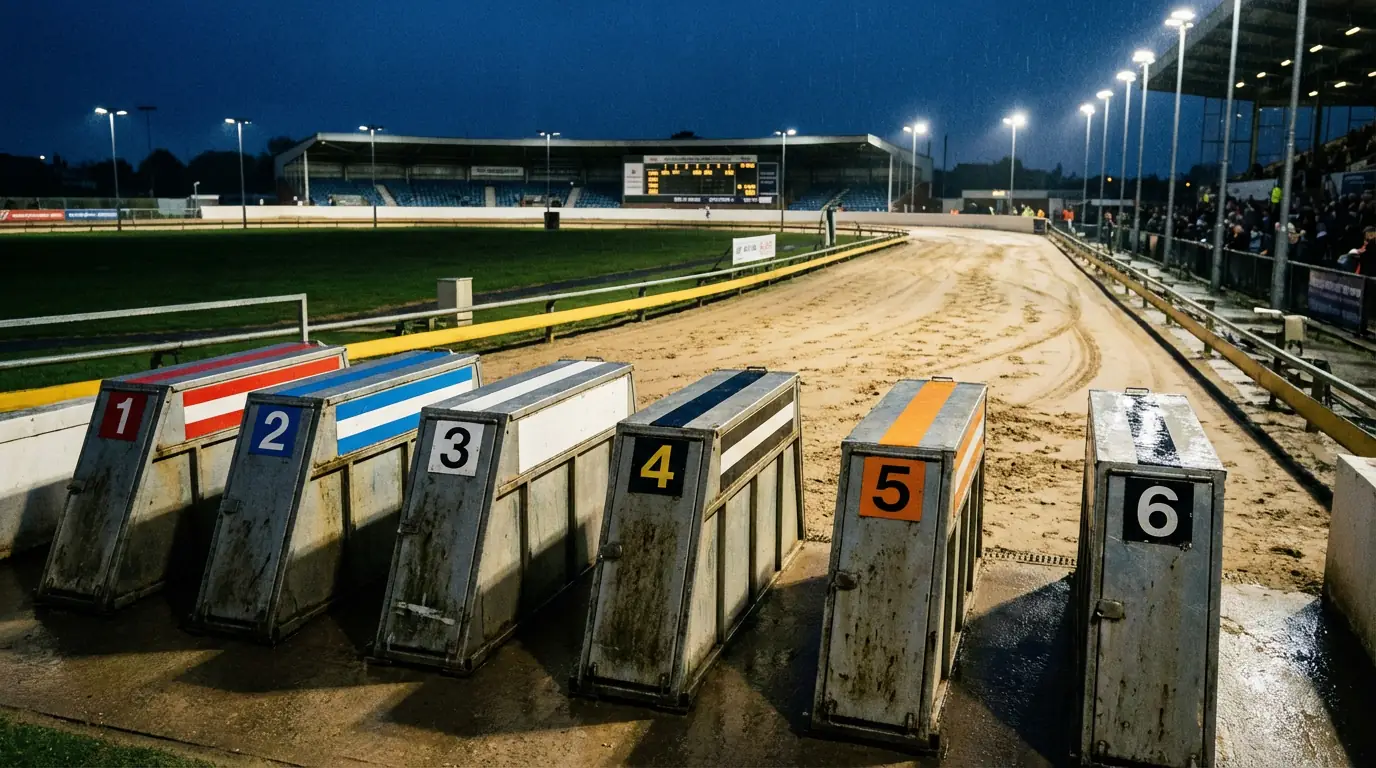
The trap colours in UK greyhound racing are standardised: red for trap 1, blue for 2, white for 3, black for 4, orange for 5, and black-and-white stripes for trap 6. Every racecard lists the trap draw, and every results page records which trap the winner broke from. This data, accumulated over months and years, tells you how a track’s geometry translates into real-world outcomes. The punters who profit from trap statistics are the ones who do the accumulation rather than relying on general assumptions about inside traps being faster.
One persistent myth deserves addressing immediately: trap 1 is not the best trap overall. Across the UK, trap 1 wins approximately 16-17% of races — marginally above the theoretical 16.67% that pure chance would predict with six runners. That fraction of a percentage point is not a betting edge. Where trap advantages become meaningful is at the track-specific level, where certain traps can win 19%, 20% or even 21% of races over a sustained period. That’s the territory where data becomes actionable.
UK Track Trap Statistics: What the Data Shows
Aggregate data across thousands of races paints a clearer picture than any single night. The most useful trap statistics are calculated over a minimum of 500 races at a given venue, which typically represents several months of regular racing. Anything less and the sample is too small to distinguish a genuine pattern from random noise. With a large enough sample, persistent trap biases emerge that reflect the physical characteristics of the track rather than short-term randomness.
At Towcester, for example, trap 1 has historically shown a noticeable advantage, with winning percentages touching 20% in some seasons — roughly three percentage points above expected. The track’s configuration, with a tight first bend close to the starting traps, gives inside runners a shorter path and a better angle into the turn. Dogs drawn inside need less early speed to secure a favourable position, which means even moderate breakers from trap 1 can find themselves at the front without spending excess energy.
At Harlow, the pattern flips. Trap 6 has recorded winning percentages above 20% in recent years, making it statistically the most productive trap at the venue. Harlow’s wider turns and longer run to the first bend reduce the inside advantage, while the specific geometry of the track allows outside runners to maintain a smooth racing line without being forced wide. The result is a track where conventional wisdom about inside traps is actively misleading.
Across most UK tracks, however, the trap differences are subtle. At Nottingham, Monmore, Hove and several other major venues, the winning percentages for all six traps tend to cluster between 15% and 18% over large samples. The variation exists, but it’s small enough that trap draw alone rarely represents a worthwhile betting angle. At these balanced tracks, the dog’s individual running style — whether it’s a rails runner, a wide runner, or a middle-seed — matters considerably more than the trap number itself.
Seasonal variation adds another layer. Trap statistics collected across an entire year blend data from summer (dry, fast tracks) and winter (wet, heavy conditions). Because weather affects trap bias, an annual summary can mask the fact that trap 1 might win 20% of its races in December but only 14% in July. The most serious trap analysts maintain separate datasets for different conditions, or at minimum compare trap stats from the current season rather than relying on year-round averages.
Where to find this data: Timeform publishes trap statistics for all GBGB-licensed venues, and OLBG maintains a regularly updated trap performance table broken down by track. Individual track websites sometimes publish their own summaries, though these tend to be less granular. Building your own database from published results — recording the trap of each winner race by race — takes effort but gives you the most up-to-date and customisable dataset.
How Weather Shifts Trap Bias
Rain pushes the advantage outward. Dry conditions flatten it. This is the single most important weather-related trap dynamic in UK greyhound racing, and it stems from the physics of how greyhounds run on sand in different conditions.
When the track is wet, the sand becomes heavier and more compacted, particularly on the inside rail where drainage is typically poorer. Dogs drawn in inside traps have to negotiate the heaviest, most waterlogged portion of the track, especially through the bends where they’re running closest to the rail. This costs them grip and speed. Outside runners, by contrast, have access to slightly drier ground further from the rail, allowing them to maintain traction more effectively through the turns.
The practical effect is measurable. At tracks where trap 1 normally wins 18% of races, that figure can drop to 14% or lower during sustained wet weather. Simultaneously, traps 5 and 6 see their winning percentages increase. The shift isn’t dramatic enough to make outside traps the clear favourites in wet conditions, but it’s significant enough to alter the value equation. A dog at 5/1 from trap 6 on a wet night might represent better value than the same dog at 5/1 from trap 6 on a dry night, because its actual chance of winning has increased relative to the market’s assessment.
Hot, dry conditions produce the opposite effect: the track surface becomes hard and fast, inside and outside dry out evenly, and the geometric advantage of the shorter inside route reasserts itself. On dry summer evenings, inside traps tend to perform at or slightly above their long-term averages, while outside traps drift back towards expected levels.
Wind is a less discussed but occasionally relevant factor. A strong headwind in the home straight slightly benefits dogs that have been sheltered behind leaders — typically those drawn inside or in the middle. A crosswind can push dogs sideways off the bends, with outside runners more exposed. These effects are marginal compared to track surface conditions, but in a sport where margins between dogs are measured in tenths of a second, marginal factors accumulate.
The practical takeaway: check the weather before you bet, and adjust your assessment of trap draws accordingly. If it’s been raining at Monmore all afternoon and the evening card is on heavy ground, the dog drawn in trap 1 has lost some of its positional advantage. The 7/1 outsider in trap 5, a dog with the pace to sit behind the leaders and swing wide off the final bend, has become a marginally better proposition than the dry-weather form suggests.
Trap Bias as a Betting Edge
A 3% trap advantage over 100 races is invisible in a single result but visible in a P&L. This is the core truth about using trap statistics for profit: the edge is real but small, and it only materialises over a significant number of bets. You will never look at a race, identify a trap bias, and know who is going to win. What you can do is consistently tilt the probabilities in your favour by incorporating trap data into your selection process, and over hundreds of bets, that tilt accumulates into profit.
The most effective way to use trap bias is as a filter, not a primary selection method. Start with form analysis: which dogs in this race have the best recent form, the most suitable running style for the track, and the strongest case for finishing in the top two? Then overlay the trap draw. If two dogs look equally strong on form but one is drawn in a statistically advantaged trap and the other in a disadvantaged one, the trap data breaks the tie. That’s a fundamentally different approach from blindly backing trap 1 in every race and hoping the geometry does the work.
Another application is in forecast and tricast betting. Trap statistics can help you identify which dogs are most likely to fill the minor placings. A dog that isn’t fast enough to lead but is drawn in a trap that consistently produces place finishers — because the track geometry funnels it into a holding position behind the leaders — is a useful inclusion in combination forecasts and tricasts even if it has little chance of winning outright.
Discipline is essential. The temptation with trap data is to see patterns where none exist, particularly after a short run of results that seem to confirm a bias. Three consecutive trap 3 winners at Perry Barr does not mean trap 3 has an advantage — it means three good dogs happened to be drawn there on those nights. Statistical significance requires hundreds of observations, not a handful. Resist the urge to overweight recent results when the long-term data tells a different story.
For punters who bet regularly at one or two tracks, maintaining a personal trap statistics log is one of the simplest and most effective analytical tools available. Record the trap of the winner in every race at your chosen venue for a rolling three-month period. Update it weekly. Over time, the patterns that emerge will be specific to your track, your conditions, and your timeframe — and they’ll be more current than any published annual summary.
The Trap Is One Variable — Don’t Make It the Only One
Trap data is a tiebreaker, not a strategy. The punters who lose money on trap statistics are the ones who elevate it from a useful input to a primary decision driver. A dog with poor form, a declining speed profile and an unfavourable grade move doesn’t become a bet just because it’s drawn in a statistically advantaged trap. The trap gives it a marginal positional benefit. It doesn’t fix the underlying problems with the dog’s ability or fitness.
Equally, a strong dog drawn in a supposedly weak trap shouldn’t be dismissed. The best greyhounds overcome positional disadvantages through sheer pace and ability. A genuine A1-standard dog drawn in trap 6 at a track where trap 6 underperforms its statistical average is still a serious contender — probably more serious than a moderate A5 dog drawn in the “best” trap. Individual class overrides aggregate statistics in almost every case.
The optimal use of trap data sits somewhere in the middle of these extremes. Treat it as one layer in a multi-factor assessment. Form is the foundation. Trap draw adds context. Track conditions adjust the context. And the price offered by the market determines whether the bet has value, regardless of what any individual data point suggests. Punters who integrate trap statistics into a broader analytical framework will extract consistent, modest value from the data. Those who treat it as a system will learn, at some cost, that no single variable in greyhound racing is powerful enough to stand alone.